Pearson Edexcel · A-Level · Mathematics
Course version: 9MA0 · Version from Mar 2026
Understand and apply the language of statistical hypothesis testing,…
Full specification wording
Statistical hypothesis testing: 5.1 Understand and apply the language of statistical hypothesis testing, developed through a binomial model: null hypothesis, alternative hypothesis, significance level, test statistic, 1-tail test, 2-tail test, critical value, critical region, acceptance region, p-value; extend to correlation coefficients as measures of how close data points lie to a straight line, and be able to interpret a given correlation coefficient using a given p-value or critical value (calculation of correlation coefficients is excluded).
A hypothesis test starts with a null hypothesis H₀, usually a claim about a population parameter, and an alternative hypothesis H₁ stating the direction or difference being tested.
Checked against the Pearson Edexcel 9MA0 specification (opens in a new tab) on .
- Point 1 of 3
- 4 key terms
Study notes
From the checked teaching notes for this specification point.
The idea
A hypothesis test starts with a null hypothesis H₀, usually a claim about a population parameter, and an alternative hypothesis H₁ stating the direction or difference being tested. The significance level α is the probability of rejecting H₀ when it is true. The test statistic is calculated from the sample; for a binomial model it is the number of successes X ~ B(n, p). A 1-tail test uses one extreme region, a 2-tail test splits α between both tails. The critical region is the set of test statistic values leading to rejection of H₀; its boundary is the critical value, and the acceptance region is the complement. The p-value is the probability, assuming H₀, of a result at least as extreme as observed. Correlation coefficients measure how closely data lie to a straight line; interpret a given coefficient against a given p-value or critical value, without calculating it.
What earns the marks
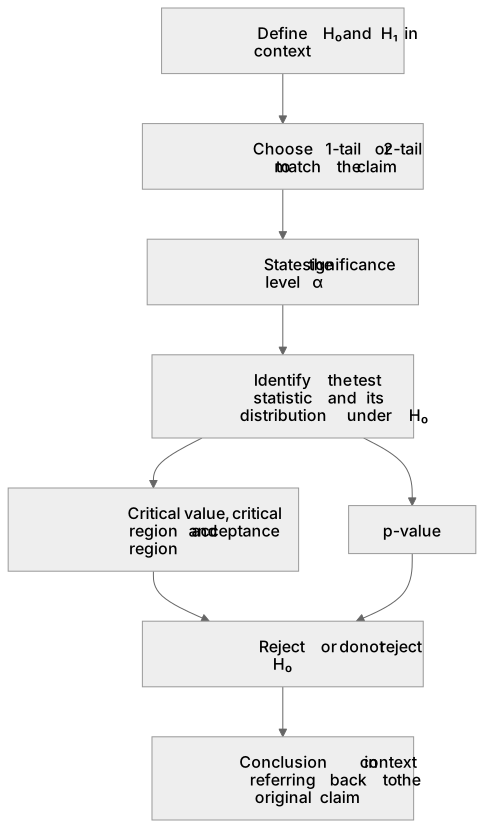
- Defines H₀ and H₁ in context, choosing a 1-tail or 2-tail alternative to match the wording of the claim.
- States the significance level and explains it as the probability of incorrectly rejecting a true H₀.
- Identifies the test statistic and its distribution, for example X ~ B(n, p) under H₀.
- Distinguishes the critical value, critical region and acceptance region, and uses them to reach a reject or do-not-reject decision.
- Interprets a p-value by comparing it with the significance level, and interprets a given correlation coefficient using a given p-value or critical value.
Common mistakes and how to put them right
Writing H₁ as an equality.
Put it right by using an inequality such as p > 0.5 or p ≠ 0.5.
Comparing the test statistic directly with the significance level.
Put it right by comparing the p-value with α, or the statistic with the critical value.
Treating a large correlation coefficient as proof of causation.
Put it right by interpreting it only as a measure of linear closeness, subject to the given p-value or critical value.
Exam tips
- Define H₀ and H₁ in words and symbols before calculating anything.
- State whether the test is 1-tail or 2-tail and show how the critical region follows from α.
- Finish with a conclusion in context that refers back to the original claim, not just to H₀.
Try the lesson
The start of the Statistical hypothesis testing: 5.1 Understand and apply the language of statistical hypothesis testing, developed through a binomial model: null hypothesis, alternative hypothesis, significance level, test statistic, 1-tail test, 2-tail test, critical value, critical region, acceptance region, p-value; extend to correlation coefficients as measures of how close data points lie to a straight line, and be able to interpret a given correlation coefficient using a given p-value or critical value (calculation of correlation coefficients is excluded). lesson, made from checked teaching notes for this specification point.
Have a go first
A test is carried out at the 5% significance level. The null hypothesis is rejected when the p-value is less than or equal to 0.05. A researcher obtains a p-value of 0.03. What is the correct conclusion?
Listen
A hypothesis test starts with a null hypothesis H₀, usually a claim about a population parameter, and an alternative hypothesis H₁ stating the direction or difference being tested. The significance level α is the probability of rejecting H₀ when it is true. The test statistic is calculated from the sample; for a binomial model it is the number of successes X ~ B(n, p). A 1-tail test uses one extreme region, a 2-tail test splits α between both tails. The critical region is the set of test statistic values leading to rejection of H₀; its boundary is the critical value, and the acceptance region is the complement. The p-value is the probability, assuming H₀, of a result at least as extreme as observed. Correlation coefficients measure how closely data lie to a straight line; interpret a given coefficient against a given p-value or critical value, without calculating it. A strong answer earns marks for these points. Defines H₀ and H₁ in context, choosing a 1-tail or 2-tail alternative to match the wording of the claim. States the significance level and explains it as the probability of incorrectly rejecting a true H₀. Identifies the test statistic and its distribution, for example X ~ B(n, p) under H₀. Distinguishes the critical value, critical region and acceptance region, and uses them to reach a reject or do-not-reject decision. A common slip: Writing H₁ as an equality. Instead, using an inequality such as p > 0.5 or p ≠ 0.5. Exam tip: Define H₀ and H₁ in words and symbols before calculating anything.
See it
Key words
Say what each word means before you turn the card.
Null hypothesis
Try answering aloud or in your head before turning the card.
Alternative hypothesis
Try answering aloud or in your head before turning the card.
Significance level
Try answering aloud or in your head before turning the card.
Test statistic
Try answering aloud or in your head before turning the card.
See every definition
- Null hypothesis
- A claim about a population parameter, usually written H₀, with which a hypothesis test starts.
- Alternative hypothesis
- Written H₁, it states the direction or difference being tested against the null hypothesis.
- Significance level
- The probability α of rejecting the null hypothesis when it is true.
- Test statistic
- A value calculated from the sample; for a binomial model it is the number of successes X ~ B(n, p).
Label the diagram
Some boxes have lost their names. Pick the right name for each number.
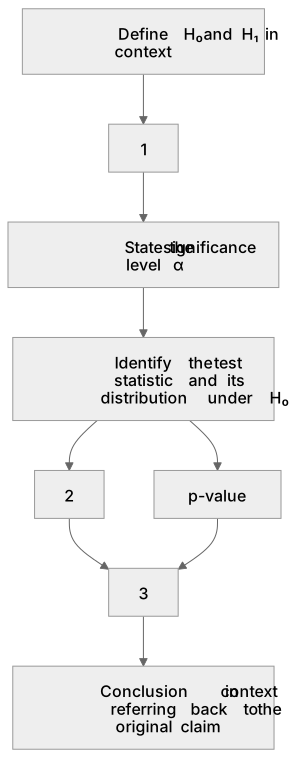
1Box 1
2Box 2
3Box 3
There is more to this lesson
The full lesson goes on to check your understanding and help you earn the marks. Create a free account to carry on, with your progress saved.
A week of Premium from your first lesson · Then the free plan continues · No card, no charge
Test your understanding of Statistical hypothesis testing: 5.1 Understand and apply the language of statistical hypothesis testing, developed through a binomial model: null hypothesis, alternative hypothesis, significance level, test statistic, 1-tail test, 2-tail test, critical value, critical region, acceptance region, p-value; extend to correlation coefficients as measures of how close data points lie to a straight line, and be able to interpret a given correlation coefficient using a given p-value or critical value (calculation of correlation coefficients is excluded).
Active recall beats re-reading. Take an instant quiz now to test what you’ve learned and lock it into long-term memory.
A week of Premium from your first lesson · Then the free plan continues · No card, no charge